
Call Stack
Enable Call Stack in the Events menu and every captured event carries the SQL Server call stack that produced it - the chain of internal engine functions that were executing at the moment the event fired. Internals Viewer combines the call stacks from every captured event into a single merged tree for the query - the Call Tree.
The tree decodes one row per frame:
- Module badge - which part of SQL Server the frame belongs to (Storage Engine, Query Processor, SQL OS, etc.)
- Category badge - what the frame is doing, classified by Internals Viewer (Query Operator, Row Access, Index Access, Page Access, Latching, Buffer Pool, etc.)
- Symbol - the function itself as
module!Class::Method, resolved from SQL Server's debugging symbols, with the offset of the call within the function
Selecting a frame shows a small histogram of when that function was active across the query - a picture of whether it was a one-off or ran throughout.
The tree gives visibility into the engine functions behind each event. Reading down the stack for a single page read during a scan, for example: the row scanner moving to the next row, the index page manager fetching the next page, the buffer pool getting the page, and a latch suspending while the I/O completes - how the operator actually executed, not just that it read a page.
Focus
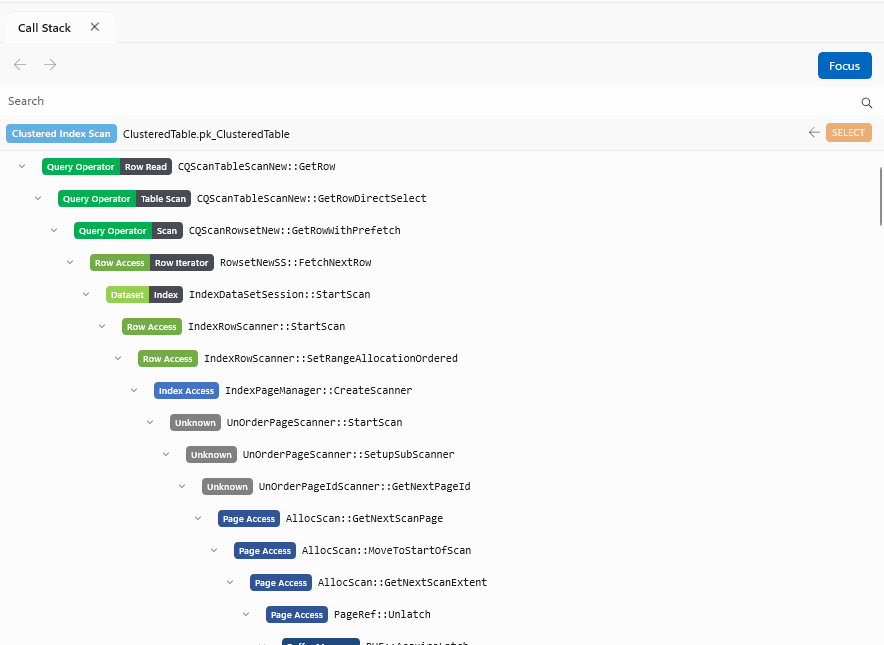
Focus, on by default, crops the tree to the event or operator currently selected - via the Timeline, the Execution Plan, or the Events pane. The header shows the selected event as a chip, with a ← link to the right showing its parent (e.g. the statement it belongs to) - click it to navigate up to the parent's call stack. The Back and Forward buttons on the command bar undo/redo this navigation.
Turning Focus off shows the full call tree for the whole query, from the top-level statement execution down:
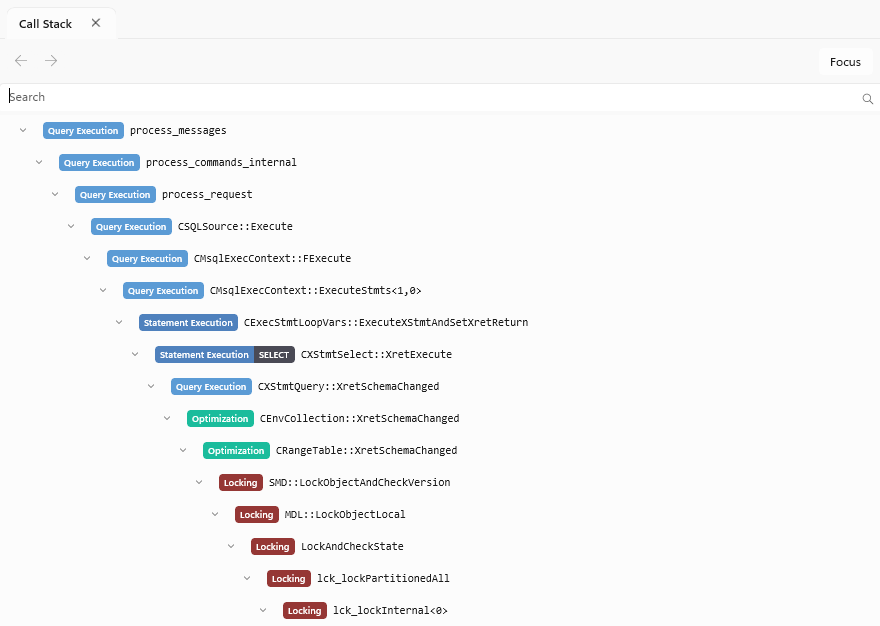
Search and navigation
The search box filters the tree to matching frames. Right-clicking a node gives:
Expand All / Collapse All - from that node down
Copy to Clipboard - copies the frame's symbol as
module!Class::MethodCopy Call Tree to Clipboard - copies a formatted, nested text representation of the stack from that node down
WinDbg - runs a debugger command aimed at the frame in the WinDbg session attached to
sqlservr.exe(see Sending Commands to WinDbg):- Set Breakpoint (
bp) breaks whenever the function is entered. Set Breakpoint With Stack prints the stack on each hit and continues, so a run can be logged without stopping it. Set Breakpoint at Frame Address breaks at the exact return address the trace captured, the instruction after the call this frame was waiting on. - Examine Symbol (
x) lists the function's address and any overloads. - Display Type (
dt) dumps the class layout and List Class Symbols lists every symbol the class declares.
A frame whose symbol did not resolve is addressed as
module+offset, so the commands still land on the right code.- Set Breakpoint (
List Members - lists the members the symbols declare on the frame's class
Right-clicking a member in the Members pane gives Copy Signature, Copy Symbol (the member as module!Class::Member, without its parameters) and the same WinDbg submenu. Debugger commands take a symbol name rather than a signature, so the parameters are dropped. Where the name is overloaded, the breakpoint commands use the member's address so the overload chosen is the one hit, and Set Breakpoint on All Overloads (bm) covers every overload at once.
Sending Commands to WinDbg
The Debugger menu on the Query document's menu bar manages the session the submenus send their commands to. Its first line shows the connection state, and the items that need a session are disabled until one is connected, as are the WinDbg submenus:
- Attach to SQL Server looks up the instance's process id with
SERVERPROPERTY('ProcessID'), starts WinDbg elevated attached to it and listening on a named pipe for Internals Viewer, then connects. Windows asks for administrator consent, since WinDbg has to run elevated to attach to SQL Server. The instance has to be on the same machine. - Connect to Session joins a WinDbg you already have attached. It has to be listening first: choosing it with nothing to connect to reports the exact
.servercommand to type into that WinDbg, and the dialog's copy button takes it to the clipboard. Type it rather than passing it with-c: a server WinDbg starts from a startup script listens but refuses every client. - Detach clears every breakpoint, detaches WinDbg from SQL Server, and drops the app's connection. WinDbg stays open with no target, so it can be closed safely. Closing a query tab does the same, so a debugger is never left attached to the instance by accident.
Commands are sent as an extra client of the session, so they and their output appear in the WinDbg window as if typed there. If the target is running when a command is sent, the app breaks in, runs it, and resumes. The pipe password is in Settings.
Nothing is needed until the first command is sent. WinDbg from the Microsoft Store has to be installed to attach, but a machine without it still does everything else. The Store package does not allow its debugger engine to be loaded by other programs, so the first use copies the engine into %LOCALAPPDATA%\InternalsViewer\WinDbg, and again whenever WinDbg updates.
Searching Symbols
Search Symbols on the Debugger menu opens the detail pane on its Symbols tab, beside Members. Typing three or more characters searches every public symbol in the modules the query's call stacks came from, so a function or class that never appeared in a stack can still be found and used. Each result has the same right-click actions as a member: copy its signature or symbol, or set a breakpoint on it in WinDbg. The first search of a module packs its PDB into an index, which takes a few seconds, and later searches are immediate.
The search box offers the symbol categories and plan operators from the call stack mappings as starting points: an empty box lists them all, categories first, and typing narrows them, so Hash offers Hash Match, Hash Match (Aggregate) and the build and probe phases. Choosing one puts its frame pattern in the box, such as sqlmin!CQScanHash*. A category, such as Category: Query Operator, searches every class and function the mappings file assigns to it. An operator with several implementations gets them all, joined with |: Sort searches sqlmin!CBpQScanSort*|sqlmin!CQScanSort*|sqlmin!CQScanTopSort*, and | works the same way in anything typed by hand, as an OR of searches.
Plain text matches anywhere. Text with * or ? is a pattern in WinDbg's style, matched against the whole name or signature, so *XeSqlPkg::vector* finds that class's members and *::GetRow every function of that name. A module! prefix confines the search to that module, so a symbol pasted from WinDbg such as sqlmin!CBpQScanColumnStoreScan::BpGetNextBatch finds exactly that function. The Module, Class and Signature toggles beside the box choose which parts are matched. None ticked searches all of them. Class matches the class name alone, and Signature reaches the parameter types, so PageId with Signature ticked lists the functions that take one.
Results are a tree of module, then class, then the members found under it. Right-clicking a module or class gives Expand All and Collapse All. A module's menu also has Exclude Module, which leaves that module out of every search from then on, and Clear Module Exclusions. The exclusions are kept in Settings, and while any are in force the last row of the results is a Clear exclusions link, with the excluded modules in its tooltip, so the way back stays in reach even when every module is excluded. The matched text is highlighted in each row, except where the row is exactly the text searched for.
Results are capped per module. A search needs a query with Call Stack events to have run first, since that is how the modules and their exact symbol files are known.
Flame Graph
When Call Stack events are captured, the Execution Plan can optionally display a Flame Graph - an icicle chart of the calls per operator.
Symbols
Turning stack frames into function names requires the debugging symbols (PDB files) for the exact SQL Server build being traced. Internals Viewer handles this automatically: the first time call stacks are processed, the required symbol files are downloaded from the Microsoft public symbol server and cached locally, and later traces resolve straight from the cache. Download progress is shown in Messages. There is nothing to install or configure - no debugging tools and no symbol server setup.
The cache location is the Symbols Path setting. The default is C:\Symbols.
See How query tracing works for how the download and resolution work.