Execution Plan
The Execution Plan pane shows the captured execution plan as a tree of operators, connected to the Timeline:
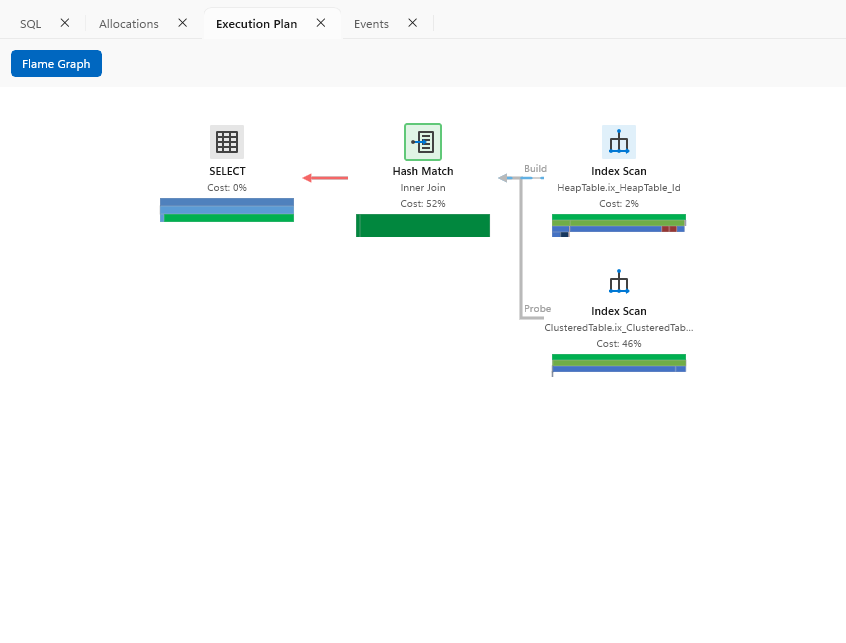
Each operator shows its name, object, and cost percentage, plus a small bar tracking its progress as the replay runs. Operators that consume more than one input, like a Hash Match join, label each input - Build and Probe for a hash join. See the Showplan operators reference for what each operator does.
During replay the plan animates what is happening at the playhead - active operators highlight, rows streaming between operators are drawn as moving flow lines (thicker lines carry more rows), and operators blocked waiting on their input are marked. The plan can be zoomed with Ctrl + mouse wheel and panned by dragging.
Selecting an operator (on the plan, the Timeline's Plan band, or the Events pane) highlights it and, if Call Stack events were captured, focuses the Call Stack pane on that operator's frames.
Right-click an operator that reads an index to open that index in the Index View, linked to the replay.
Flame Graph
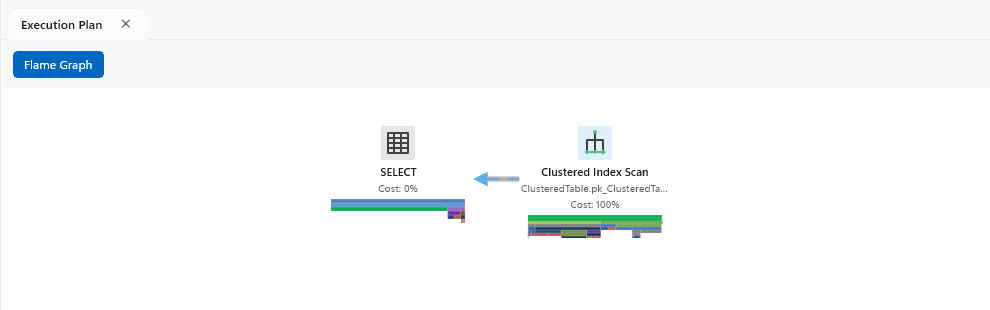
When Call Stack events are captured, the Flame Graph toggle on the command bar replaces each operator's progress bar with an icicle chart of the calls made by that operator, coloured by the same category colours as the Call Stack pane - showing where an operator actually spent its time, not just its overall cost: