
Events
The Events pane is the raw data behind the Timeline - every captured event in a list, in time order. The timeline bands are a visualization of exactly this list, so this is where to go for the precise detail behind a tick on the timeline - which page a read touched, what lock mode was taken, or what the engine was waiting on.
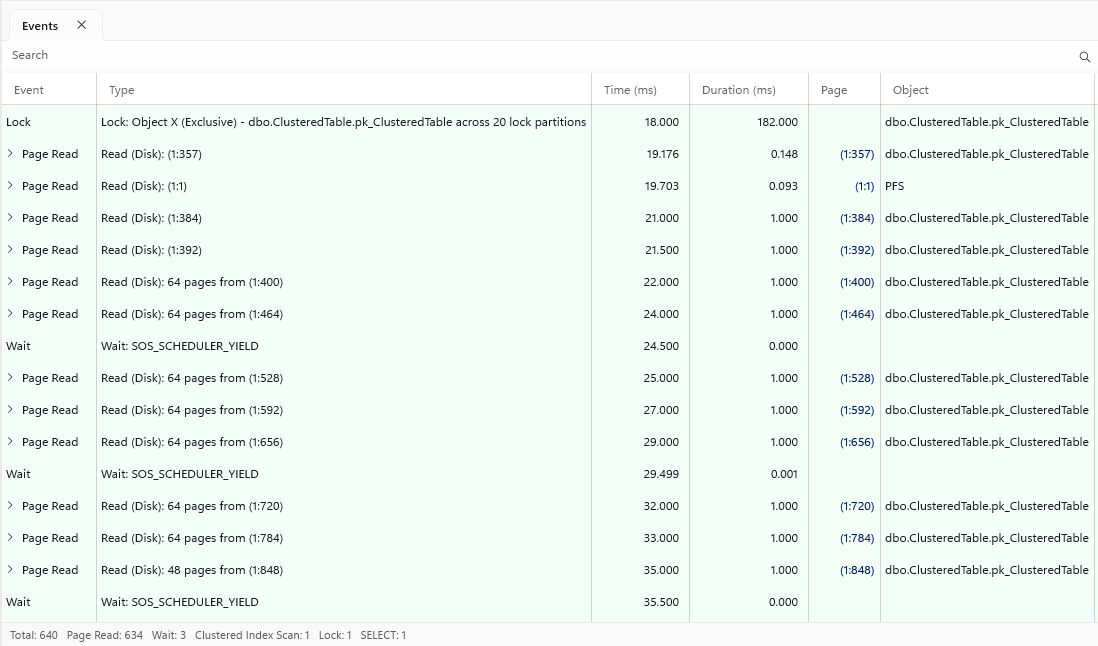
Each event shows its type, a description, its time and duration in milliseconds, the page it relates to, and the object that page belongs to. Columns can be sorted by clicking their headers, and the search box filters the list across every field.
The status bar at the bottom counts the events by type - a quick summary of what the query did.
The Details toggle in the tab strip opens a pane beside the list showing every property of the selected event - the raw values behind the description, such as a latch's class and address, a segment scan's encoding and dictionary sizes, or the object type an object pool lookup was for.
Working with events
- Click an event to select it - the selection is shared with the timeline and, for operator events, the Execution Plan and Call Stack panes. Click the selected row again to deselect it
- Reads that cover multiple pages (a multi-page disk read, for example) have an expander - open it to see the individual pages within the read
- Page addresses are links - click to open the page as a tab within the Query view, or Shift + click to open it in a separate top-level tab. Pages opened this way carry the query's captured log records with them
- Selecting a time range on the timeline highlights the events inside the range, scoping the list to the window being investigated