
Log Records
When Trace mode is on and a query is detected as a data modification query (INSERT / UPDATE / DELETE etc.), the query runs inside a transaction, its transaction log records are captured, and the transaction is then rolled back - so the database is left in its pre-query state.
Operations surviving rollbacks
Not everything rolls back. For example, the next IDENTITY value and certain allocation flags are not restored by the rollback.
Why log records, not page writes
Internals Viewer captures log operations rather than watching for page writes, because of the Lazy Writer. A record is considered modified as soon as the transaction log has been written - the page is modified in the buffer pool and marked dirty at that point. The Lazy Writer eventually persists the change to disk, but this can happen long after the query finishes, so tracing physical writes wouldn't reliably capture the change at the time it logically happened.
Buffer Pool Clean vs Dirty pages
The Buffer Pool overlay on the Allocations map shows clean vs dirty pages, so it pairs well with this: run an update, see the page go dirty (red), then run CHECKPOINT and see it turn clean (cyan) as the Lazy Writer flushes it.
Log records appear at the top of the Event Timeline, alongside the other captured activity.
Trace mode captures both the log events on the timeline and the raw transaction log entries, which can be replayed on a page to show what each log operation actually changed.
How log records are parsed
Internals Viewer parses log records from the raw binary rather than relying on SQL Server's own interpretation of them. Because the live transaction log file is held with an exclusive lock by the SQL Server process, Internals Viewer still needs fn_dblog to read it - which comes with the limitation that log records larger than 8000 bytes are truncated.
Page Log Operations
With Trace mode on, opening a page that was touched by the traced query - via double-clicking on the Timeline, or clicking a page in the Events pane - shows a Log Operations panel in the bottom right of the Page Viewer, listing every log record that changed that page:
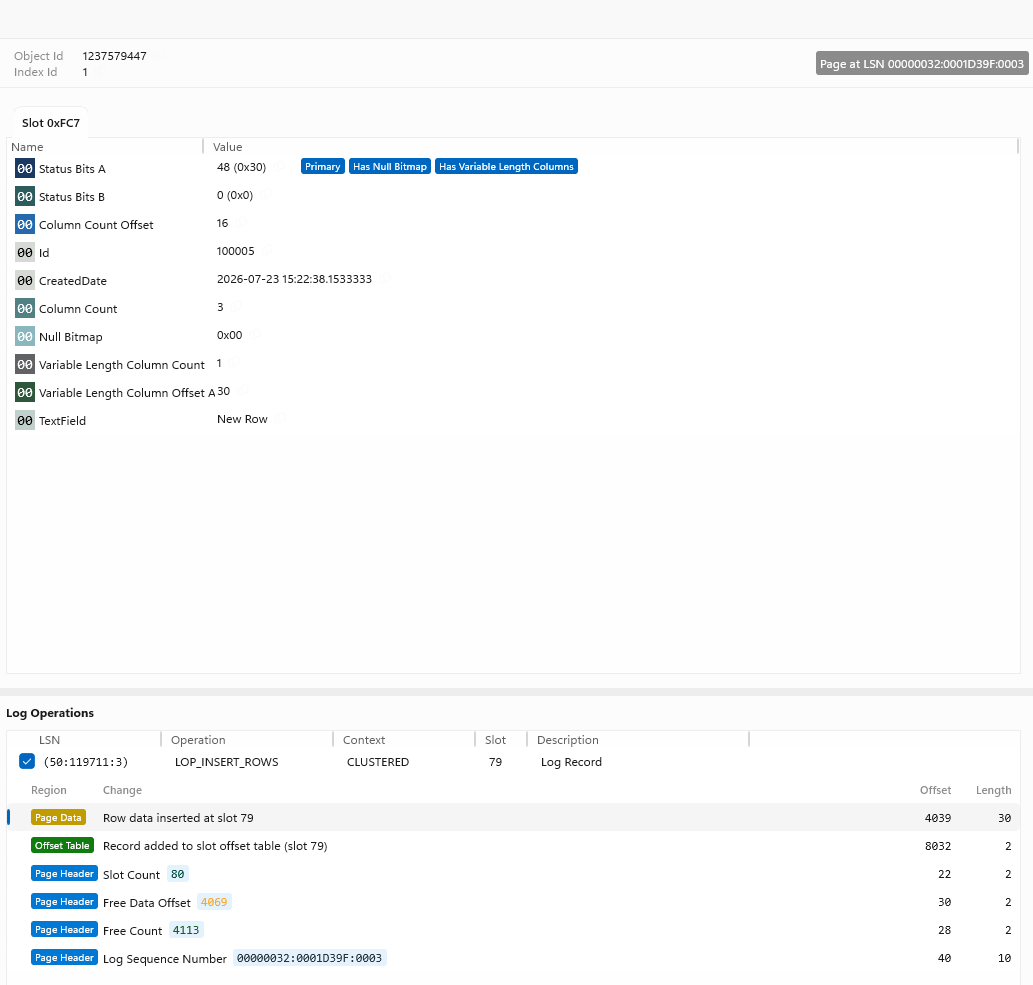
Log operations must be applied in order, since each one is relative to the changes before it. Ticking an operation applies it, along with every earlier operation it depends on, and shows what changed. Unticking it removes its application, letting you compare before and after:
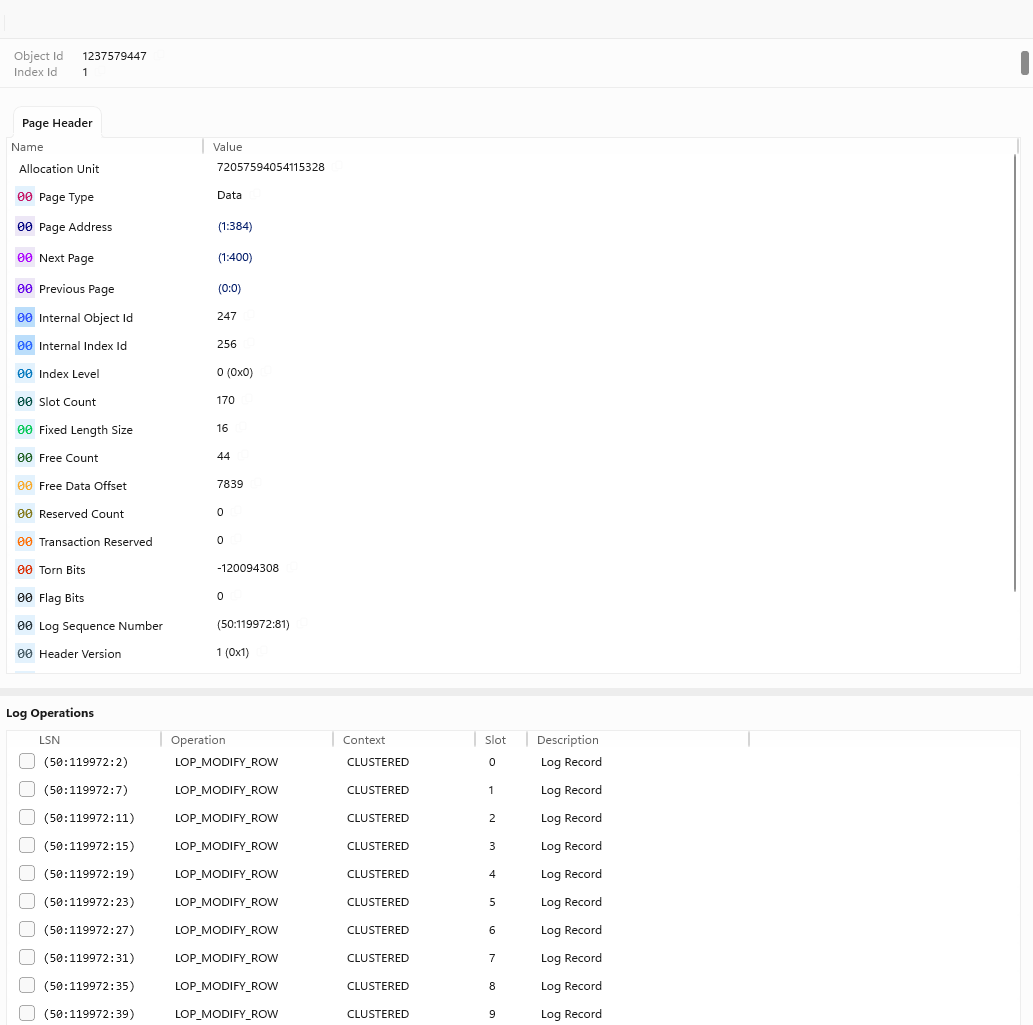
The page's current state is shown top right as Page at LSN, followed by the LSN value. If a log operation can't be applied (e.g. a log sequence error, or an unexpected slot) that is shown too, with the reason.
Each applied operation lists its individual changes:
| Field | Description |
|---|---|
| Region | Where on the page the change happened - Page Header, Offset Table, or Page Data |
| Change | A description of what changed, colour coded to match the hex viewer's marker colours |
| Offset | The byte offset of the change within the page |
| Length | The length of the change, in bytes |
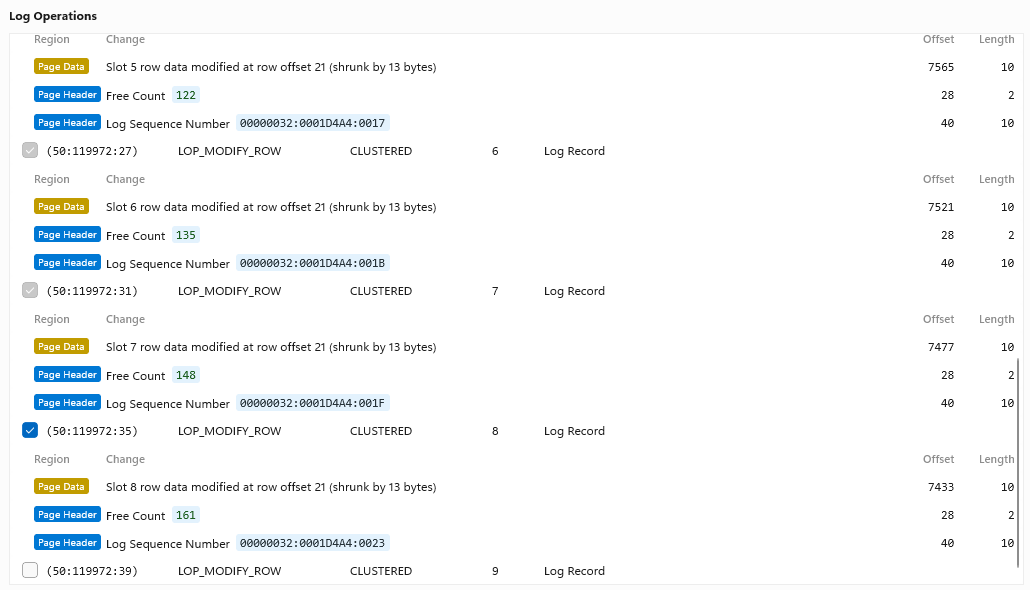
When a change is applied, the affected region gets a grey border in the raw data. Selecting an individual change scrolls the hex viewer to it and turns the border red.
Log operations are applied from a combination of the data in the log record itself, and a recreation of what SQL Server does to a page when it applies that operation. A Page Data region is usually a direct insert/splice from the log record, while an Offset Table or Page Header change is more often inferred from what that operation is known to do to those structures.
See Log Appliers for how each operation type is applied, and the tutorial's Log Records part for a worked example.