Timeline
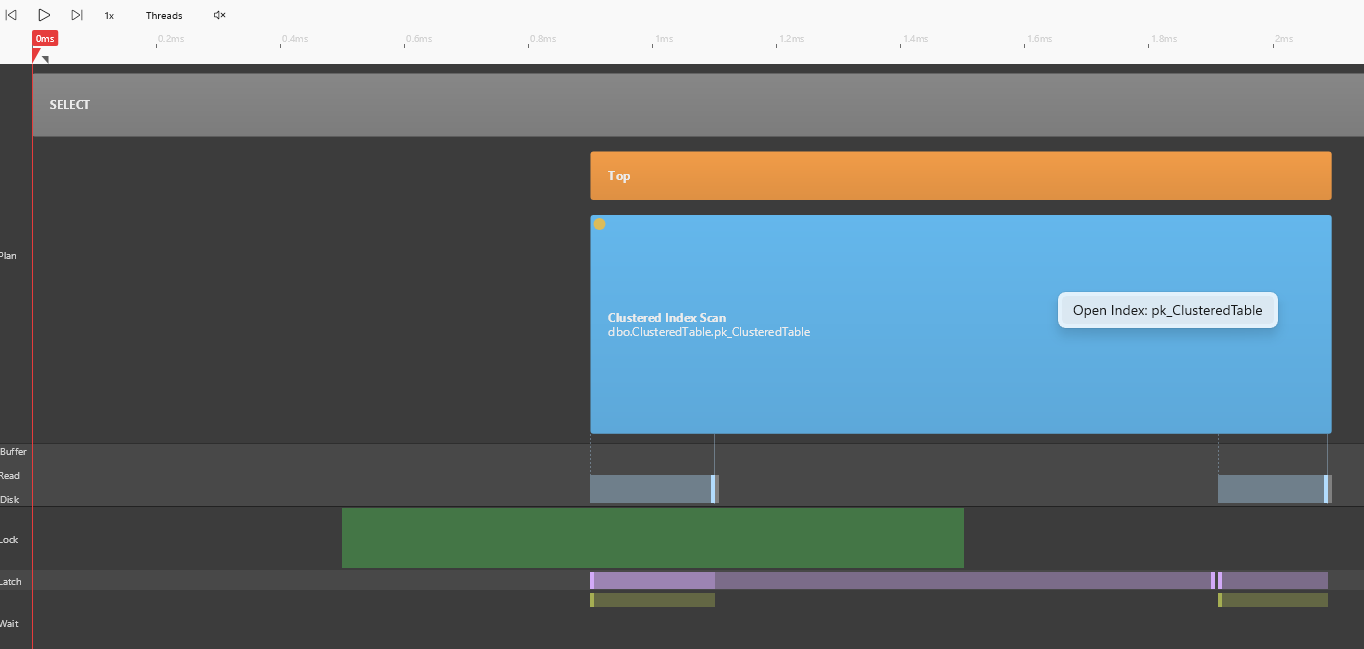
The Timeline shows the captured query activity against time, and replays it like a recording.
It is split into bands:
- Plan - the execution plan operators, one bar per operator showing when it was active
- Read - physical page reads, see Reads
- Lock - locks acquired and released, see Locks
- Latch - latches acquired and released, see Latches
- Wait - waits, where the query had to stop and wait for a resource, see Waits
Bands can be split into lanes that further categorize the events on the band - see each band's page for its lanes.
Hovering over the timeline shows a tooltip describing the event under the pointer.
Playback
The playback controls replay the query like a recording - play/pause, step, and speed - and the red playhead can be dragged to scrub through the trace.
- The step buttons jump the playhead to the previous or next read event
- The speed button cycles through 0.5x, 1x, 5x, and 10x
- The Threads toggle overlays the worker threads of parallel operators on their bars in the Plan band - each worker drawn across its own active time and sized by its share of the rows, so time skew and data skew between threads are visible
- The audio toggle adds sound to the replay - a tone per read as the playhead sweeps, so the access pattern can be heard as well as seen
Zoom and selection
The timeline can be zoomed with the mouse wheel, centred on the cursor, from the whole query down to individual events - with a scrollbar to move through the trace while zoomed in.
Dragging the handles either side of the playhead selects a time range. The selection scopes what is highlighted in the Events pane, making it easy to answer "what happened in this window". Double-click the playhead to clear the selection.
Selecting and opening events
- Click an event to select it - this also selects the matching row in the Events pane
- Double-click an event that has a page associated with it (a read, a lock, a log operation) to open that page in the Page Viewer
- Click an operator's bar in the Plan band to select it and highlight when it actually streamed rows - blocking operators like a Sort consume their input for most of their lifetime and only stream at the end
- Right-click an index in the Plan band to open it in the Index View, linked to the trace so pages light up as they are read