
Views and layout
The View menu has additional panes that can be opened alongside the SQL editor - see Views for the full list.
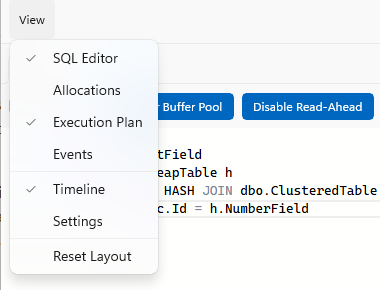
Each pane opens as a tab, and tabs can be dragged into whatever layout suits the investigation - drop a tab beside another pane to split the space, or onto a pane to stack them (see Layout in the user guide). For example, you can keep the SQL editor on the left, dock the Allocations or Index view on the right to watch during replay, and put the Execution Plan below - with the timeline always along the bottom.
Watching reads on the allocation map
Open View → Allocations to see the allocation map next to the SQL editor:
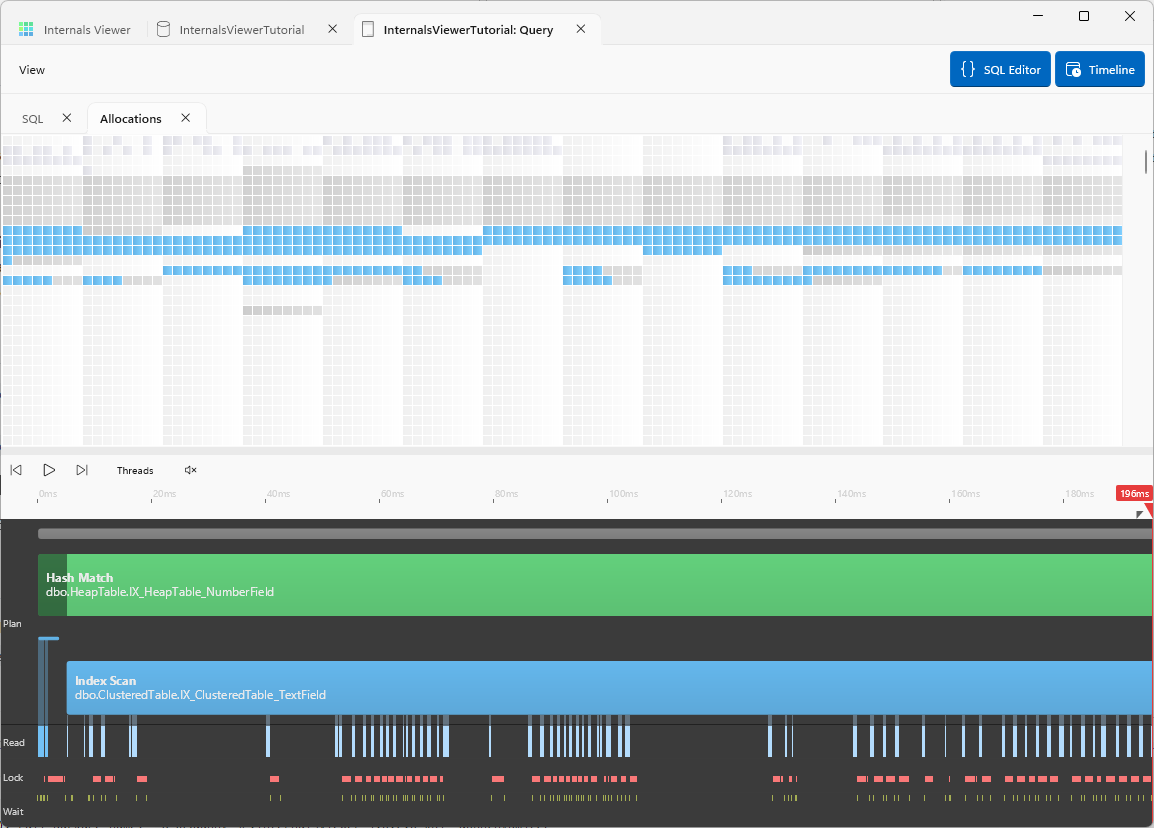
Now replay a trace. As the cursor moves through the timeline the pages being read are highlighted on the allocation map - you can see the physical shape of the query:
- The index seek query from the previous page touches a few scattered pages - root, intermediate, leaf
- The scan query sweeps through the table's extents in order
- With read-ahead enabled the reads jump ahead in large blocks. With it disabled they crawl page by page
TIP
The allocation map - and the Index view - can be zoomed in and out with Ctrl + mouse wheel, so you can go from the whole file down to individual pages while the replay runs.
This connects everything from the earlier parts: the extents allocated in Part 1, the linked pages from Part 2, and the index levels from Part 3 are what the engine is navigating in real time.
The Events pane
Open View → Events to see the raw data behind the timeline - every captured event in a list: batch start and end, each physical page read with its page address, each lock with its mode and resource, each wait with its type and duration.
The timeline lanes are a visualization of exactly this list. The Events pane is where to go when you want the precise detail behind a tick on the timeline - which page a read touched, what lock mode was taken, or what the engine was waiting on. See Events in the user guide for everything it can do.
Next: The execution plan