
The execution plan
Open View → Execution Plan to see the captured plan:
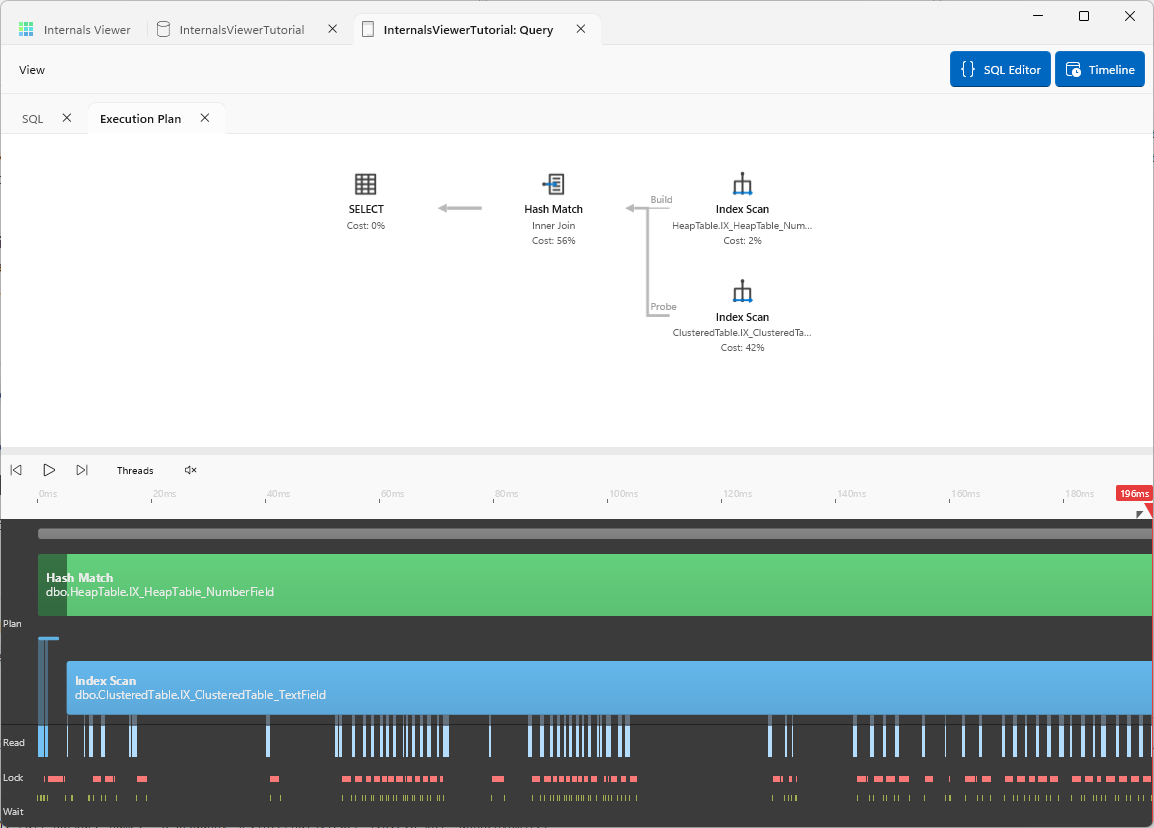
The plan shows the operator tree with the object each operator uses and its relative cost. But unlike a static plan, this one is connected to the timeline: the operators match the bars in the Plan lane, and during replay the plan shows what each operator is doing at the current point in time - where data is streaming between operators, and where an operator is blocked waiting on its input.
This makes the behaviour of the different operator types visible:
- Streaming operators pass rows on as they receive them - a scan feeding a SELECT streams from start to finish
- Blocking operators have to consume input before they can produce output. A Hash Match join shows its two phases: the build phase, where it reads the entire build input into a hash table while nothing flows downstream, then the probe phase, where it streams the probe input through the hash table and starts emitting rows
- A Nested Loops join shows its access pattern - one row at a time from the outer input, each driving a seek on the inner input, visible as a rapid repeating pattern of small reads in the timeline
Joins makes these behaviours concrete by tracing the same join three ways - but first, Scans vs seeks compares the two access patterns underneath every plan.
TIP
If Call Stack events are captured, the Flame Graph toggle breaks each operator's time down into the engine calls that made it up - see Execution Plan.
Next: Scans vs seeks