
Query
The Query view runs SQL against the connected database while tracing what the storage engine does - every physical page read, lock, latch, wait, and plan operator - then replays the activity on a Timeline.
Open it with the Query button on the database toolbar.
Running a query
Enter SQL in the editor and press Execute. The query runs with a trace session, and when it completes the captured activity loads into the timeline.
The editor's command bar has toggles for tracing options and result display - see SQL Editor for the full set, and Multi-statement queries for tracing a single statement out of a larger script.
WARNING
Data modification queries (INSERT / UPDATE / DELETE) are run inside a transaction that is rolled back after the trace is captured, so the data is left unchanged. See Log Records for how this works and what it captures.
Events menu
The Events menu selects what the trace captures:
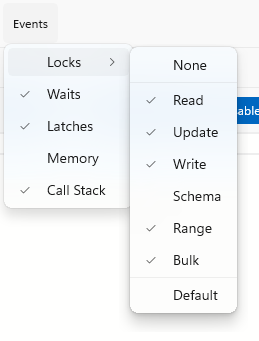
Page I/O is always captured. Locks opens a submenu of lock categories to capture (Read, Update, Write, Schema, Range, Bulk, or None/Default) - by default this excludes Schema locks, since they are held for a large part of the query's lifetime and would otherwise dominate the Locks band. Waits and Latches can be toggled independently, as can Columnstore (segment scans, rowgroup elimination, rowgroup reads and object pool lookups - on by default), Memory (grants, spills, and sort warnings) and Call Stack - see Call Stack.
Query menu
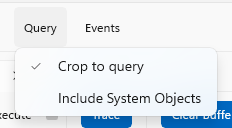
- Crop to query - on by default. Limits the captured trace to the statement being run, rather than everything happening on the connection
- Include System Objects - includes system tables and indexes in captured events, normally filtered out
Views
The View menu opens additional panes:
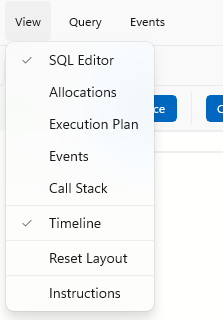
- SQL Editor - the query editor
- Allocations - the allocation map, scoped to the query - see Allocations
- Execution Plan - the captured plan, connected to the timeline - see Execution Plan
- Events - the raw list of captured events behind the timeline - see Events
- Call Stack - the decoded SQL Server call stack for the current event - see Call Stack
- Timeline - the replay timeline - see Timeline
- Reset Layout - restores the default pane arrangement
- Instructions - a quick reference for the view
Pages and indexes opened from the trace - by double-clicking a timeline event, clicking a page link in the Events pane, or right-clicking an operator - also open as panes, so everything about the query stays in one tab.
Layout
Panes are tabs that can be dragged into any layout - drop a tab beside or below another pane to split the space, or onto a pane to stack them. While dragging, the drop zones highlight to show where the tab will land.
The Details and Timeline buttons on the top right show and hide the two halves of the view - the pane area and the timeline - with a splitter between them to adjust the balance.
The layout is remembered - the pane arrangement, timeline visibility, and the Query and Events menu options are all restored the next time a Query tab is opened. Reset Layout on the View menu puts everything back to the default.
How this works
The query runs with an Extended Events session filtered to the connection, capturing page reads, locks, waits, per-operator profiles, and the execution plan. The events are matched to plan operators to build the timeline.
See How query tracing works for the details.
Next steps
For a walkthrough, the tutorial's Query section traces queries against a sample database - including scans vs seeks and the three physical join operators.