
Full Trace
Record Full Trace on the Trace menu records the query with Microsoft's Time Travel Debugging (TTD) and replays the recording, so the Call Tree holds every call the query made rather than the stacks captured when events fired.
The normal Call Tree is built from samples. A stack is captured each time an event fires - a page read, a lock, a latch - so the tree only holds the code that happened to be running at those moments. Work done between events is invisible, and the relational operators publish no events of their own, so a Hash Match or a Stream Aggregate is only seen when it calls down into something that does. TTD records every instruction the process executes, so nothing is missed - every call, how many times it was made, the memory it allocated and the values it was passed.
WARNING
Full Trace is for development and test instances only. Every run needs administrator consent and can restart the SQL Server service, dropping every connection to it. The recorded query runs around 25 times slower, and a few seconds of recording writes several gigabytes.
Turning it on
Turn on Record Full Trace on the Trace menu. The first time, a dialog explains what a recording involves - Turn On turns it on and Cancel leaves it off. Tick Do Not Show Again to stop the dialog appearing, and the Time Travel Warning setting brings it back.
While it is on, a red Full Trace badge sits at the end of the menu bar, because every Execute in that tab is recorded until it is turned off. Click the badge to turn it off. It is not remembered - a new Query tab always starts with it off.
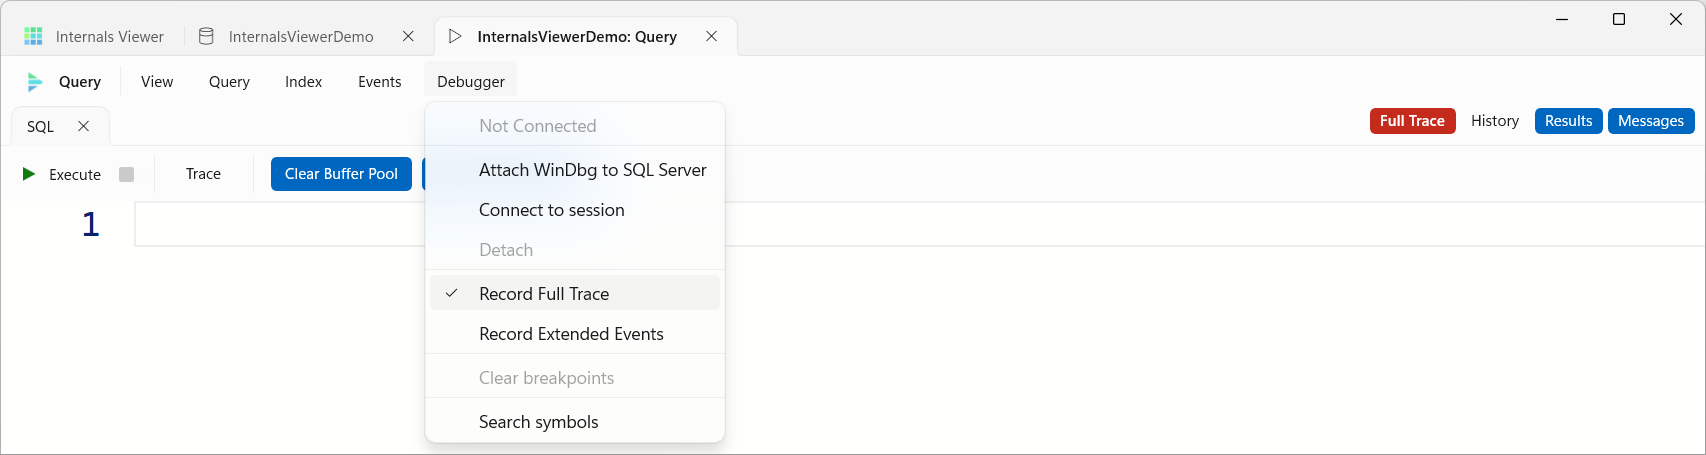
Turning it on also changes the layout straight away. A recording has no clock, so the Timeline, Events and Allocations panes are hidden and their View menu items disabled, and the Trace Timeline takes the Timeline's place - at the bottom in the default layout. Turning it off puts the previous layout back.
Turning Record Full Trace on also starts preparing the symbols the replay needs, in the background, so they are ready by the time the first recording finishes.
Requirements
- Same machine - TTD records a process on the machine it runs on, so SQL Server has to be on the same machine as Internals Viewer. Against a remote instance, Execute fails with a message naming both machines.
- WinDbg - the recorder comes from WinDbg from the Microsoft Store, the same installation the WinDbg Path setting finds. If it is not installed, turning on Record Full Trace shows the ways to install it - the Microsoft Store,
winget install Microsoft.WinDbg, or Microsoft's Install WinDbg page. The SQL Server service cannot load the recorder from inside the Store package, or from a copy in the user profile, so turning on Record Full Trace copies it into%ProgramData%\InternalsViewer\TimeTravel\Recorder, and it is copied again whenever WinDbg updates. - The TTD licence - TTD will not record until its licence has been accepted. Until it has been, turning on Record Full Trace shows the licence terms of the TTD installed with WinDbg. Accept has TTD record the acceptance, so the terms are shown only once. Decline leaves Full Trace off.
- Administrator consent - attaching a recorder to the SQL Server service needs administrator rights, so each run starts the Internals Viewer Trace Harness (
InternalsViewer.TraceHarness.exe) elevated. Windows asks for consent with a User Account Control prompt, and declining fails the run.
What happens on Execute
- Preparing - the UAC prompt appears and the harness starts. If SQL Server has already been recorded since it last started, the harness restarts the SQL Server service first, along with any running services that depend on it such as SQL Server Agent, and waits for the database to come back online. TTD can never be unloaded from a process once it has attached, and attaching a second time records nothing useful, so each recording needs a fresh SQL Server process. The restart drops every connection to the instance and leaves the buffer pool and plan cache empty. There is no restart at the end of the run. From here on the Call Tree and Trace Timeline panes show each step as it goes, with a Cancel link in the Call Tree.
- Warming up - unless Clear Buffer Pool is on, the query runs once untraced, on its own connection, inside a transaction that is rolled back. With Clear Buffer Pool off you are not asking to see disk reads, and the warm-up keeps them out of the recording, along with compiling the plan - both would otherwise swamp the query's own work. A query with
OPTION (RECOMPILE)still compiles inside the recording. - Recording - just before the Extended Events session starts, TTD attaches to SQL Server, recording only the storage engine and the query processor. The query runs, and the recording stops as soon as its results have been read.
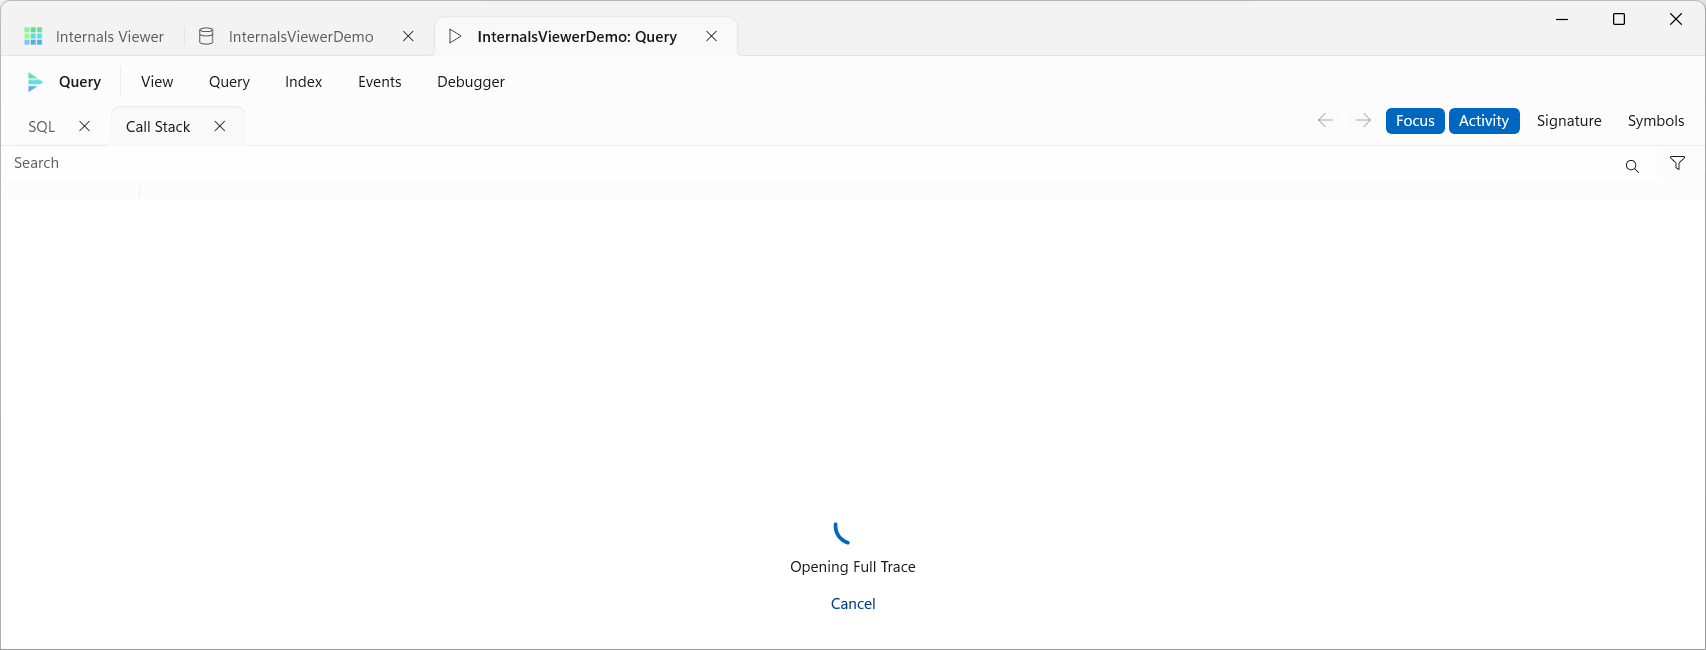
- Loading - the results, messages and execution plan appear as soon as the query finishes, and the recording loads in the background - it is opened, then replayed. The Call Tree and Trace Timeline panes keep showing its progress while it loads. Messages and the taskbar show each step as it goes - Opening Full Trace, Resolving Symbols, Replaying Threads, Building Call Tree and Matching Operators - and the Diagnostic log records how many calls were replayed. When it finishes, the Call Tree and Trace Timeline fill in.
Time and space
The numbers get large quickly, so it is worth keeping the query small:
- Recording - the recorded query runs around 25 times slower than it does untraced, and a few seconds of recording writes several gigabytes.
- Opening - the replay engine reads the whole recording before it can replay any of it, which takes a minute or more and uses about as much memory as the file is large. The replay itself is quick by comparison.
- Files - recordings are written to
%ProgramData%\InternalsViewer\TimeTravel\Traces, in a folder per run. A recording is deleted once it has replayed successfully, and anything left from an earlier run is cleared when the next recording starts. To keep a Full Trace for later, use Export to file on the Query menu - see Exporting a run. The export holds what the replay produced, not the recording, so it is much smaller and opens without replaying anything.
What a recording shows
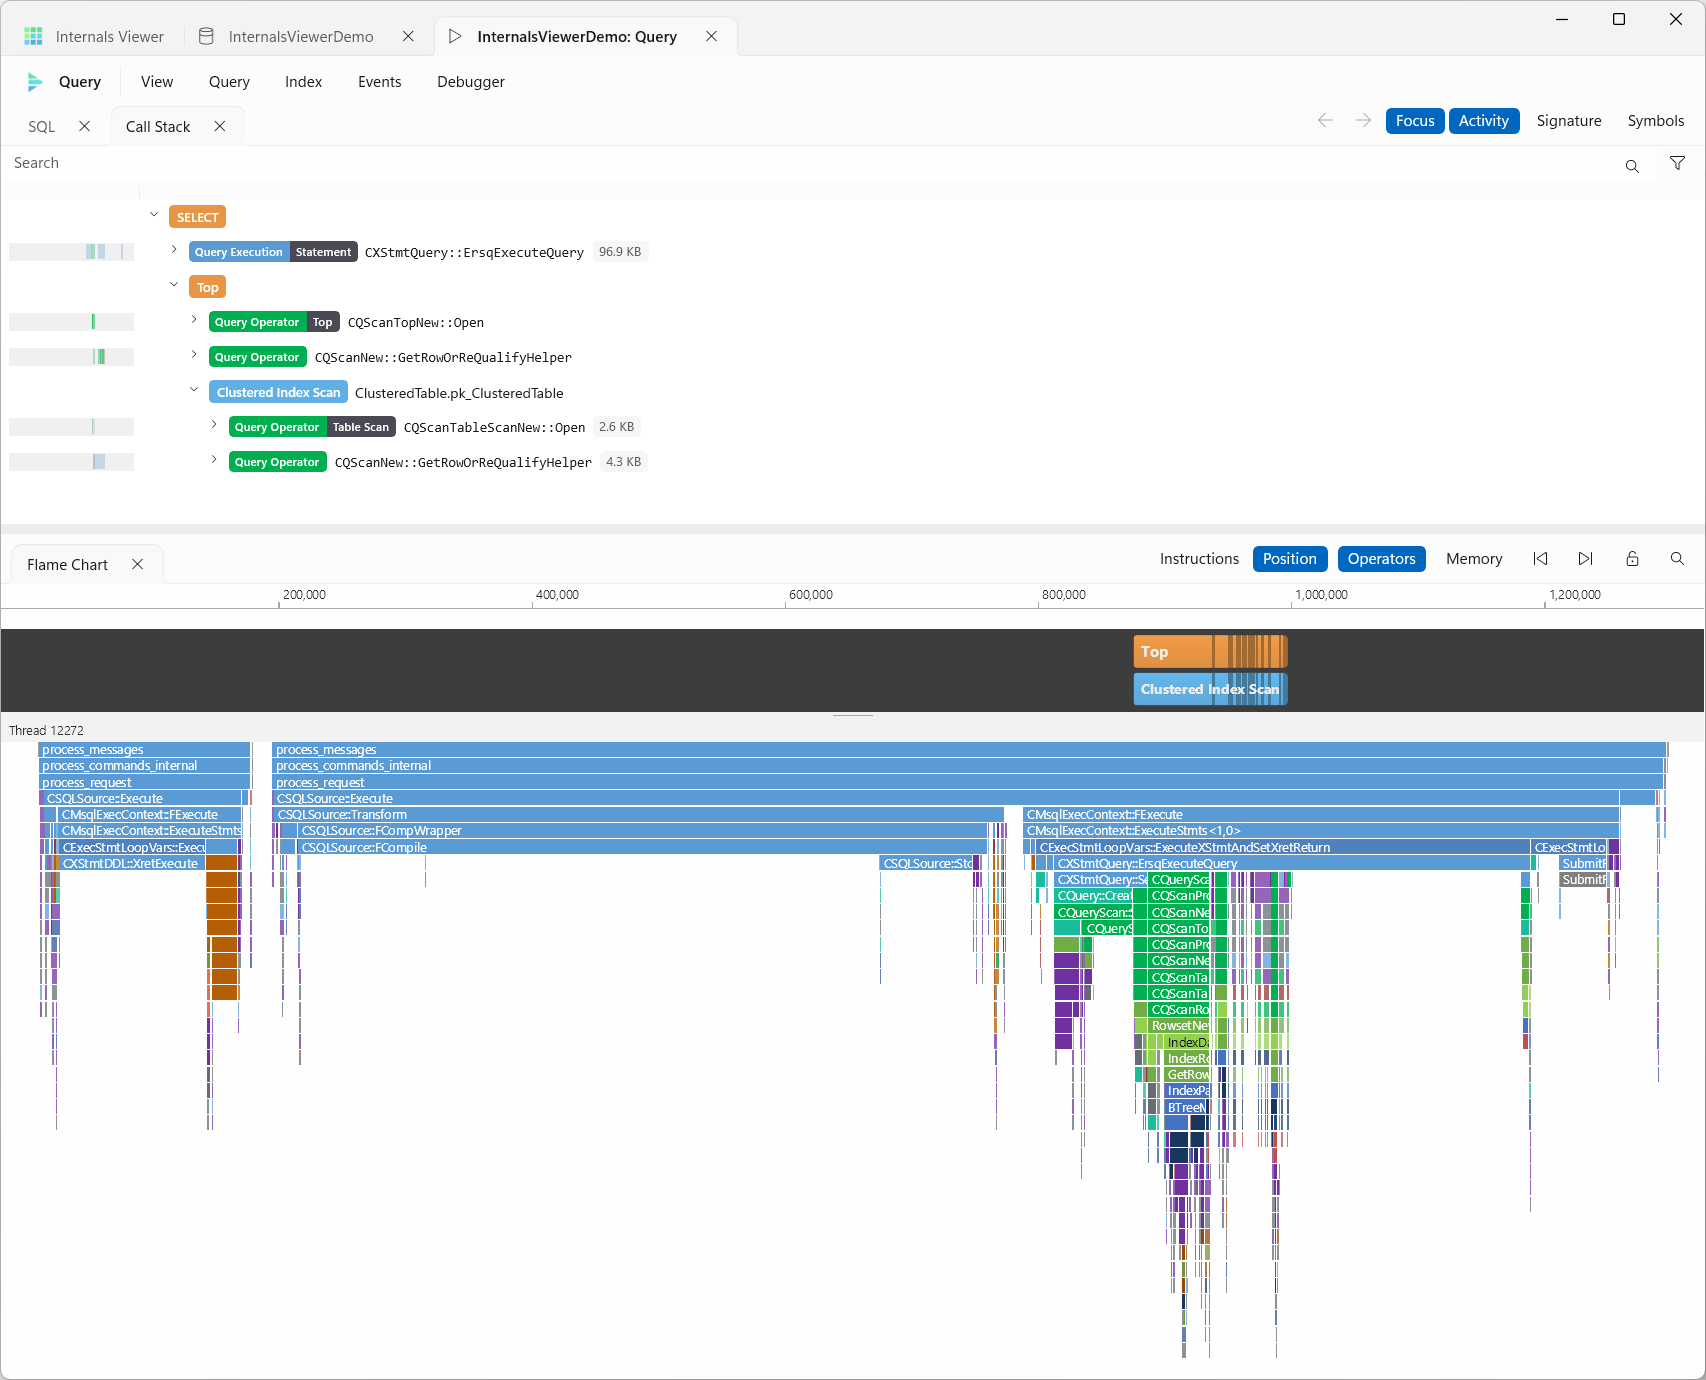
- Call Tree - every call on the query's threads, merged into one tree with a count on each path. The activity band at the left of each row shows when that path ran across the recording, and its tooltip gives the count. Each frame shows the memory allocated beneath it, with the number of allocations in its tooltip. The Extended Events and tracing machinery is left out, so the tree is the query's own work. With Crop to query on, the tree starts at the statement's execution rather than at the top of each thread, so the batch handling above it is left out too, and the activity bands span the query's execution rather than the whole recording.
- Operators matched to iterators - each plan operator is matched to the iterator object that ran it, not just its class, so two operators of the same kind - the two seeks under a Nested Loops, say - keep their own frames. An operator's frames carry the table or index it read, so the two seeks can be told apart at a glance. The Diagnostic log records how many of the plan's operators were matched.
- Trace Timeline - every call drawn against the recording, one lane per thread.
- Arguments - the values each call was passed and returned, from the Call Tree's right-click menu.
Extended Events in a recording
A recording runs with a minimal event session: the batch start and end, the operator profiles, the actual plan, and the parallelism waits CXPACKET, CXCONSUMER, CXSYNC_PORT and CXSYNC_CONSUMER. Extended Events is code SQL Server runs on the query's own thread, so under a recording every event published is more calls recorded. With the normal set the event machinery made up most of the recording - cutting it back took one query from 24.5 million recorded calls to half a million, and made the recorded query five times faster.
The parallelism waits are there to find the threads. A recording holds every thread in SQL Server, and the replay only follows the query's. Every parallel worker waits on a parallelism exchange at least once, and the wait names the thread it happened on, so those waits are how the workers are found.
Limits
- Two modules - only the storage engine and query processor are recorded. SQLOS, the layer that handles scheduling, memory and synchronisation on every thread, is not. Calls into it from the recorded modules are still seen, which is how memory allocations are counted.
- Pooled threads - workers are pooled, so a worker's thread can run an unrelated task inside the recording - a Query Store flush, say - and those calls appear in the tree too.
- Unmatched operators - an operator whose iterator is inlined into its parent, or whose methods the compiler folded away, cannot be matched. It keeps its place in the plan with nothing beneath it.
- No time - TTD records instructions, not time, and the recording slows everything down anyway, so nothing in a Full Trace is in milliseconds. The Trace Timeline measures in trace positions or instructions instead.
How this works
The recording is made by an elevated harness that attaches TTD to SQL Server, restarting the service first if an earlier recording is still loaded in it. The recording is then replayed once, from start to finish, and every call on the query's threads goes into the call tree, the Trace Timeline and a log of call arguments. Operators are matched by the iterator object each call ran on, found from the calls that build the plan's iterators, and memory is counted from the calls to SQL Server's allocators.
See How Full Trace works for the details.